Cohort analysis for a small store, in a spreadsheet.
A cohort analysis shows whether the customers you win today come back as often as those you won last year. You need an order export, a spreadsheet and about an hour.
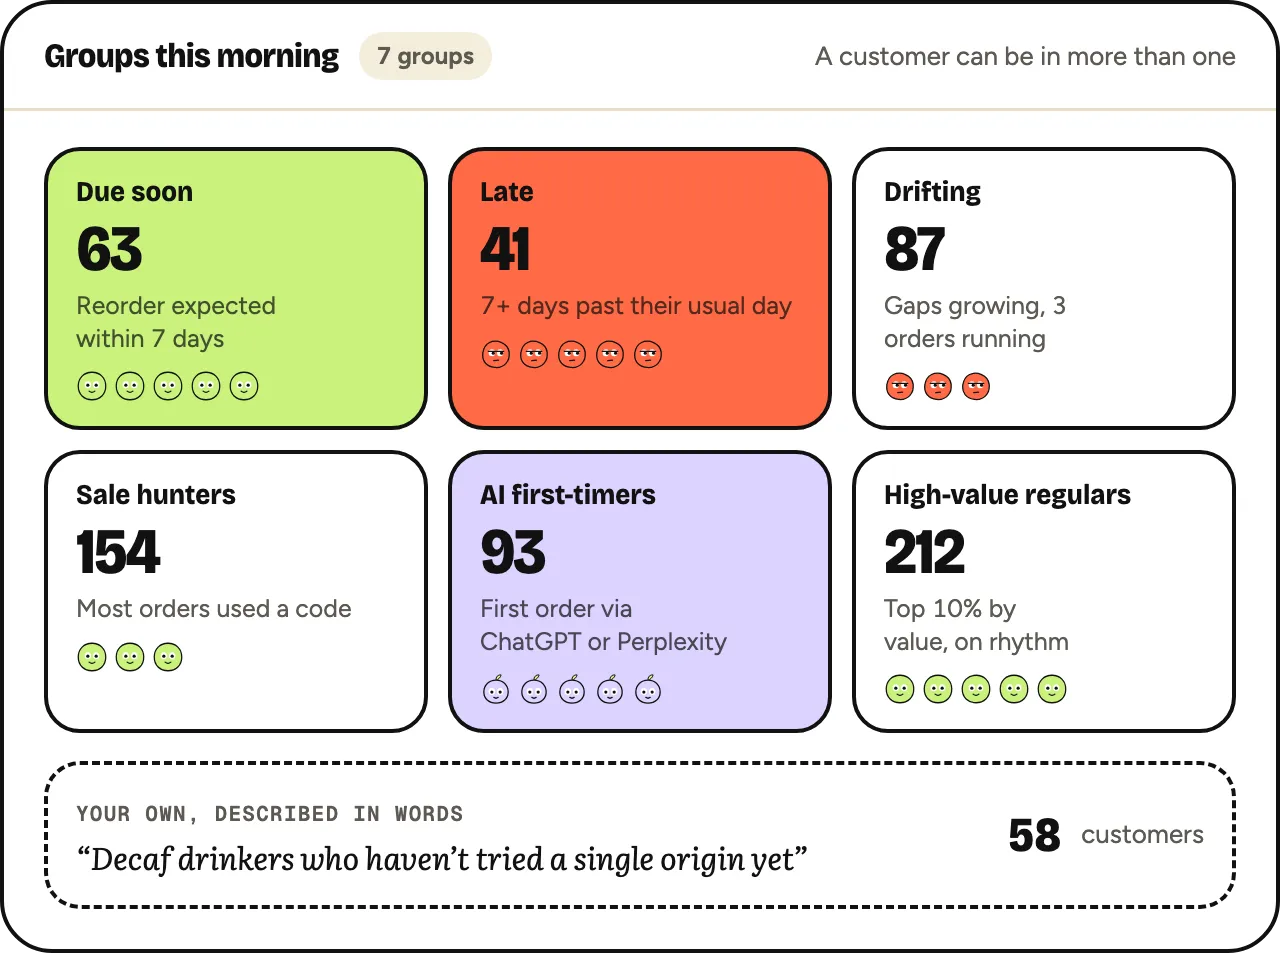
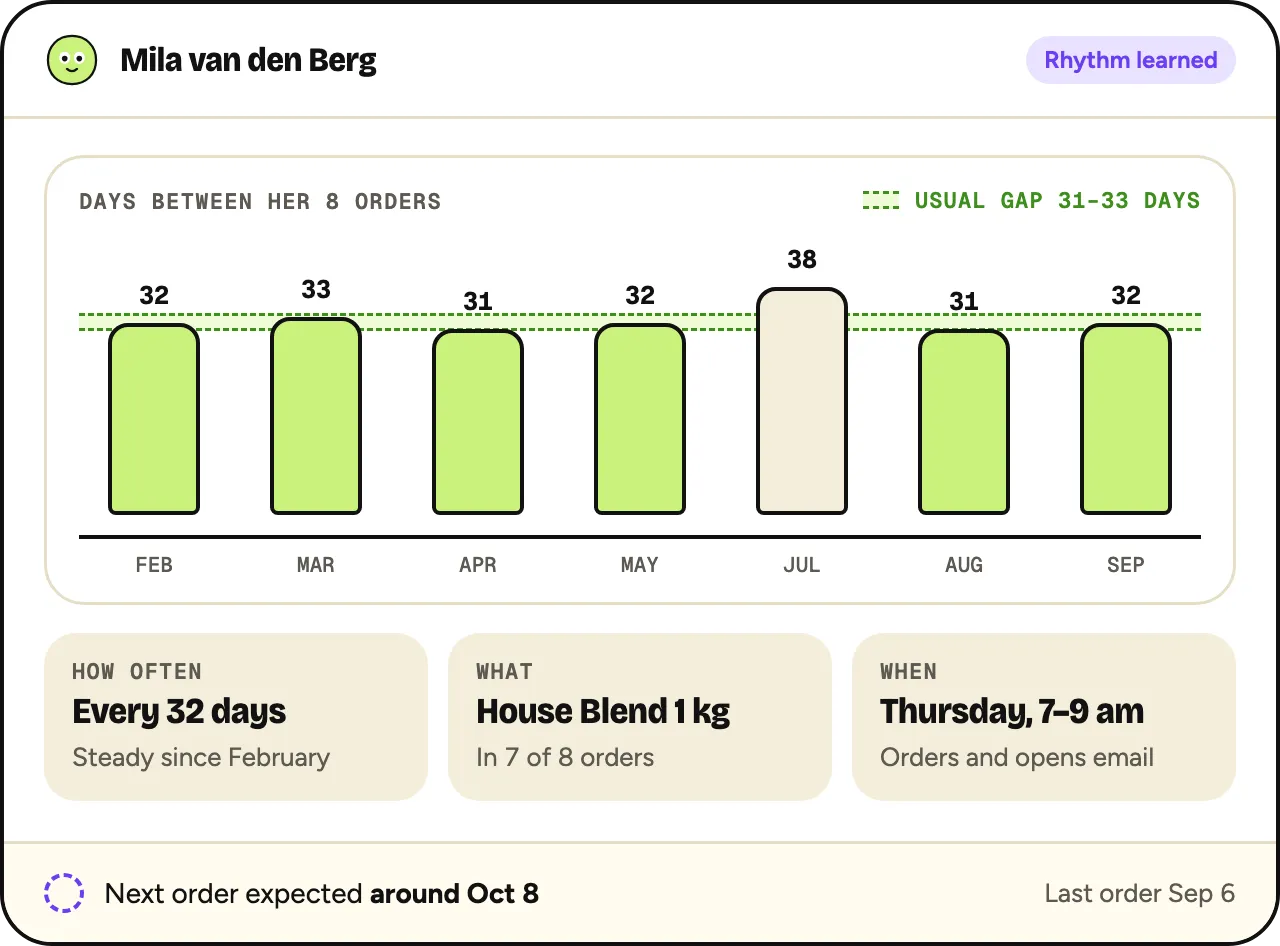
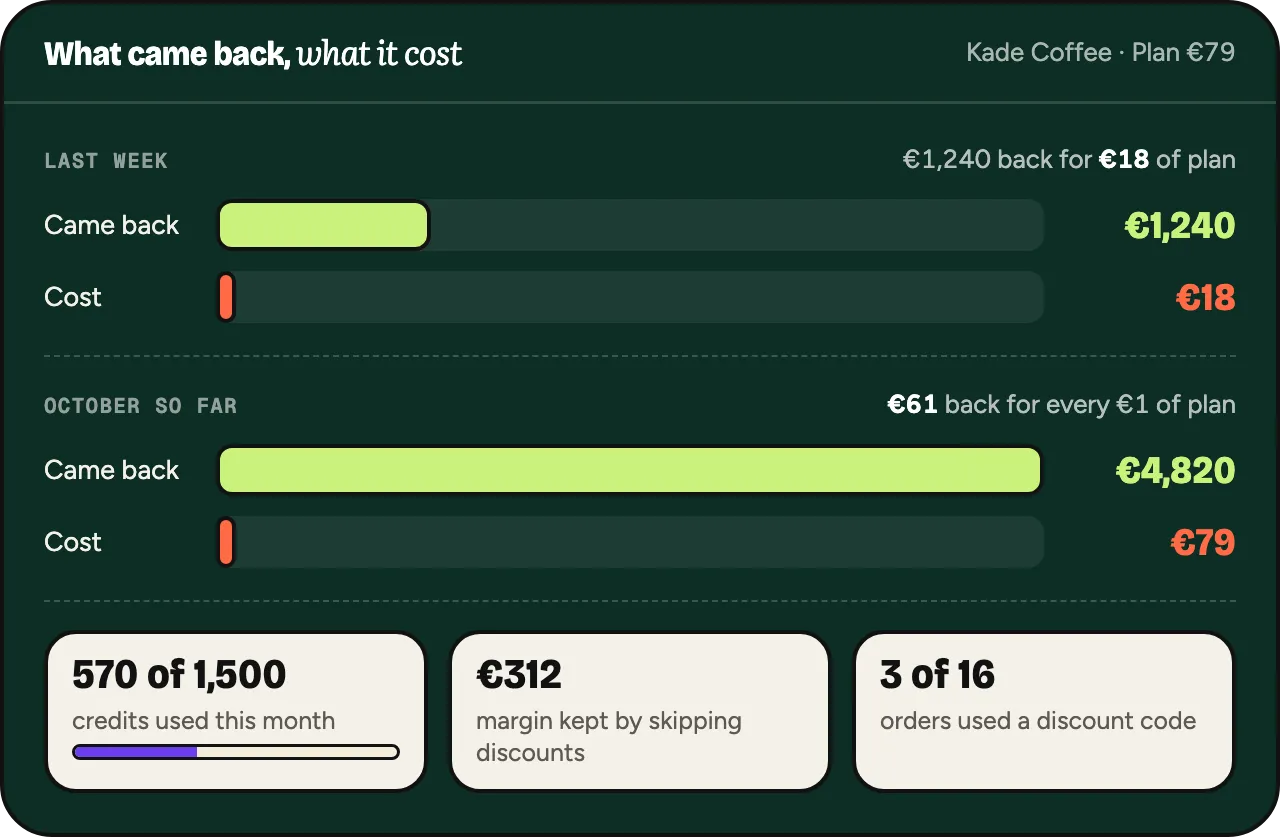
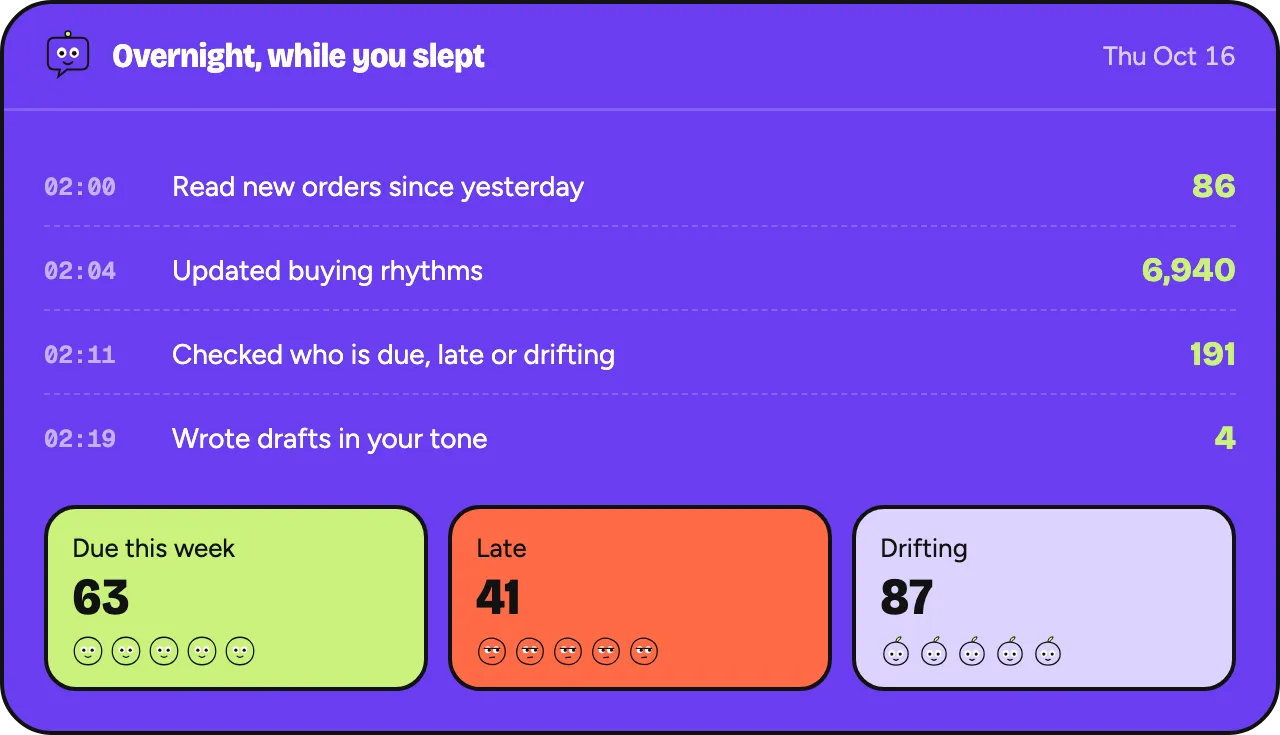
Oftenflow does this per customer, every morning.
Join the waitlistPrepare the export
- Export orders with customer ID or email, order date and order total.
- Remove test orders, cancelled orders and full refunds.
- Merge duplicate customers, such as a guest checkout and an account with the same email.
- Add a column with each customer’s first order date: the earliest date for that customer.
- Add the cohort (month of the first order) and the months since that first order.
Months since first order = (order year − first order year) × 12 + (order month − first order month).
Build the retention table
Make a pivot table. Rows are cohorts, columns are months since the first order. Each cell holds the number of customers from that cohort who ordered in that month.
Count each customer once per month, not each order. Month 0 is the cohort size. Divide every cell by month 0 to get percentages.
The January cohort has 250 customers. In month 1, 30 of them order again: 12%. Month 2: 20 (8%). Month 3: 25 (10%). The February cohort has 200 customers; in month 1, 18 order again (9%).
Reading the table
Read across a row to see how one cohort behaves over time. Read down a column to compare cohorts at the same age.
Calendar effects run diagonally. A sale in May lands in a different column for each cohort.
- A column that falls for newer cohorts: recent customers come back less than older ones did.
- One cohort that stands out: check what brought it in, such as a campaign, a channel or a first-order discount.
- A bump in the same month for every cohort, for example month 1: often the natural reorder moment of your main product.
Monthly or cumulative
The table above counts who ordered in each month. One customer can count in month 1 and again in month 3.
A cumulative table counts who has ordered again at least once by that month. It only goes up, and it’s easier to compare between cohorts. Make both if you can.
Cumulative retention (month n) = customers with a repeat order in months 1 to n ÷ cohort size.
Common traps
- Reading the newest cohorts as weak: their right-hand cells are empty because those months haven’t happened yet.
- Trusting percentages on tiny cohorts. With 40 customers, one customer is 2.5 points. Combine months into quarters.
- Counting orders instead of customers, so one heavy buyer fills a cell.
- Counting subscription renewals as returning customers. Analyse subscribers separately.
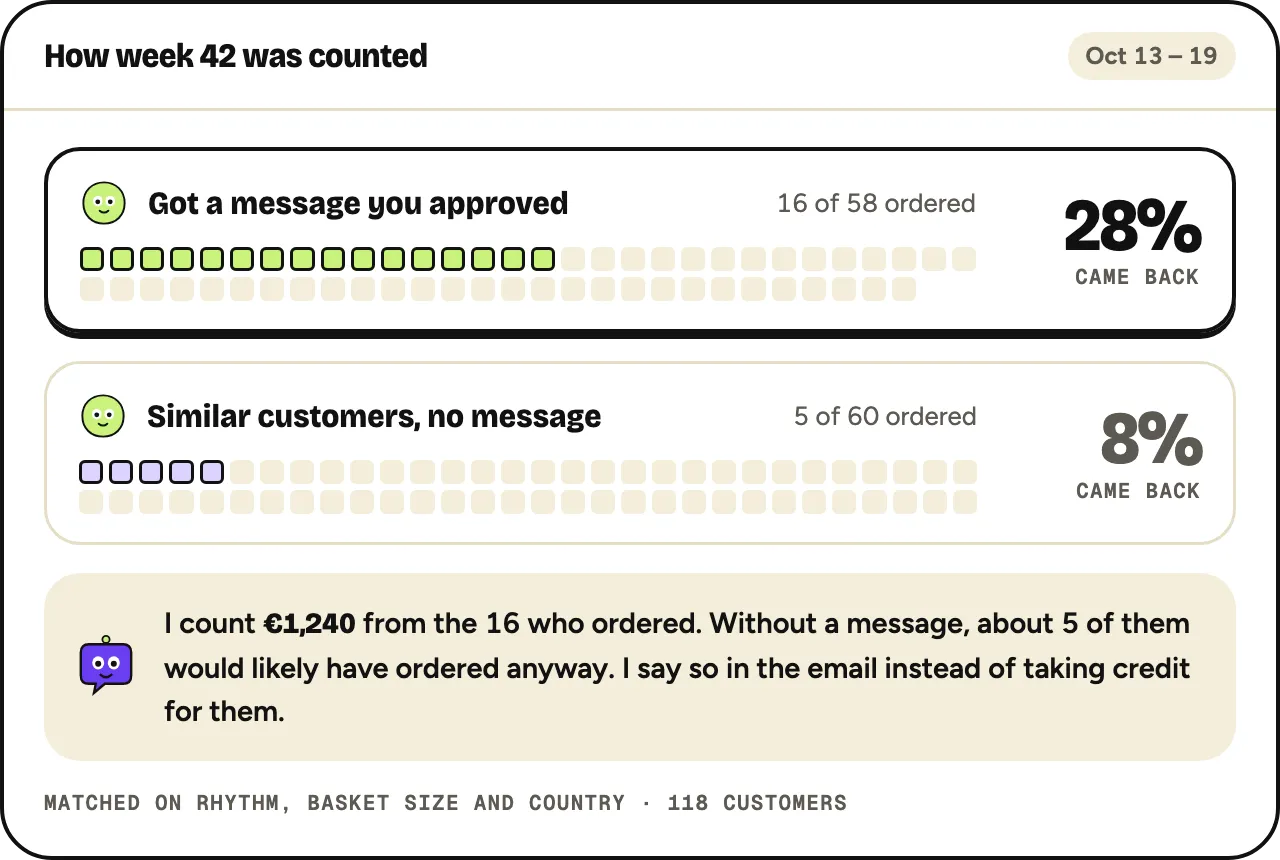
A cohort table shows the trend. Oftenflow’s Monday email adds the weekly view: who came back after messages you approved, against customers who got nothing.
Oftenflow is in development. This describes what we’re building.