Customer lifetime value without fooling yourself.
Customer lifetime value is what a customer brings in over their whole time with your store. A big number is easy to calculate. One you can safely spend against takes more care.
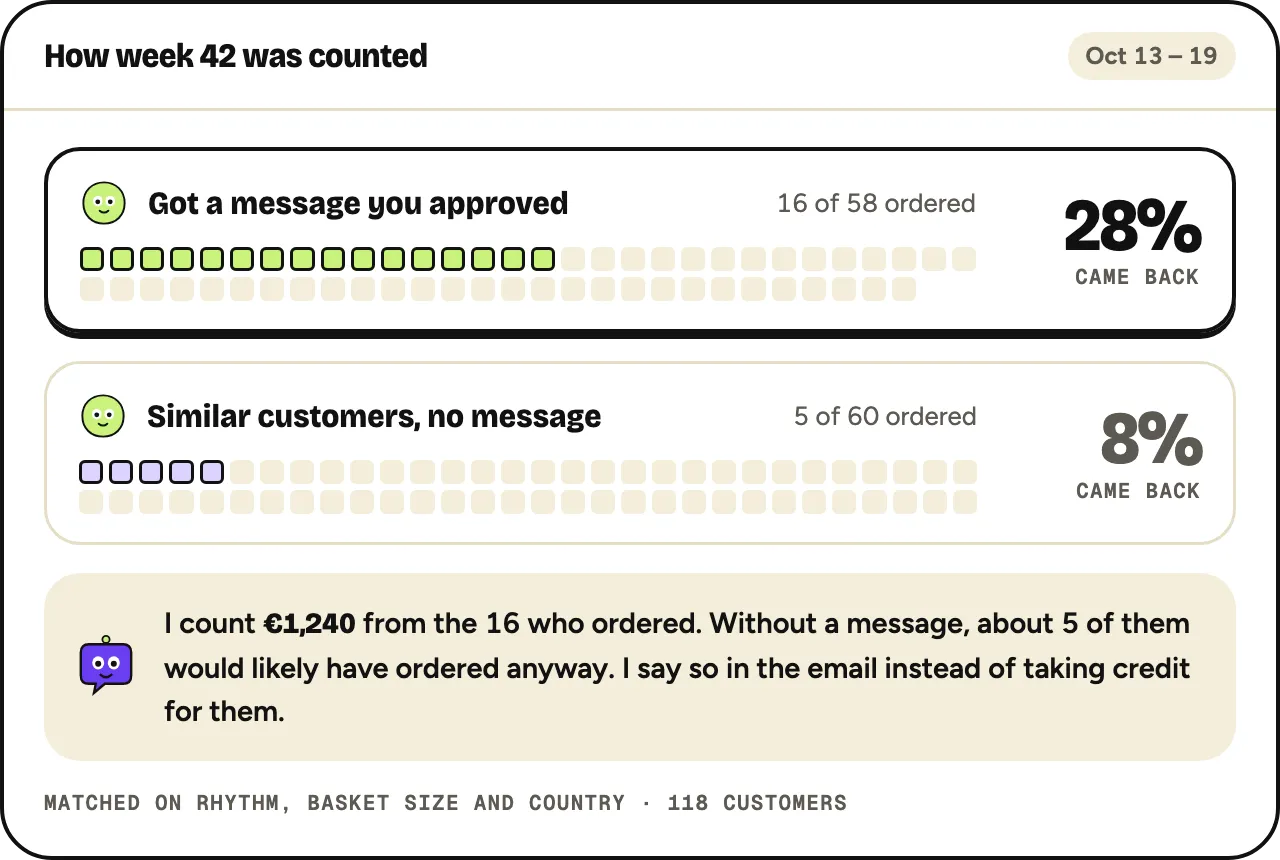
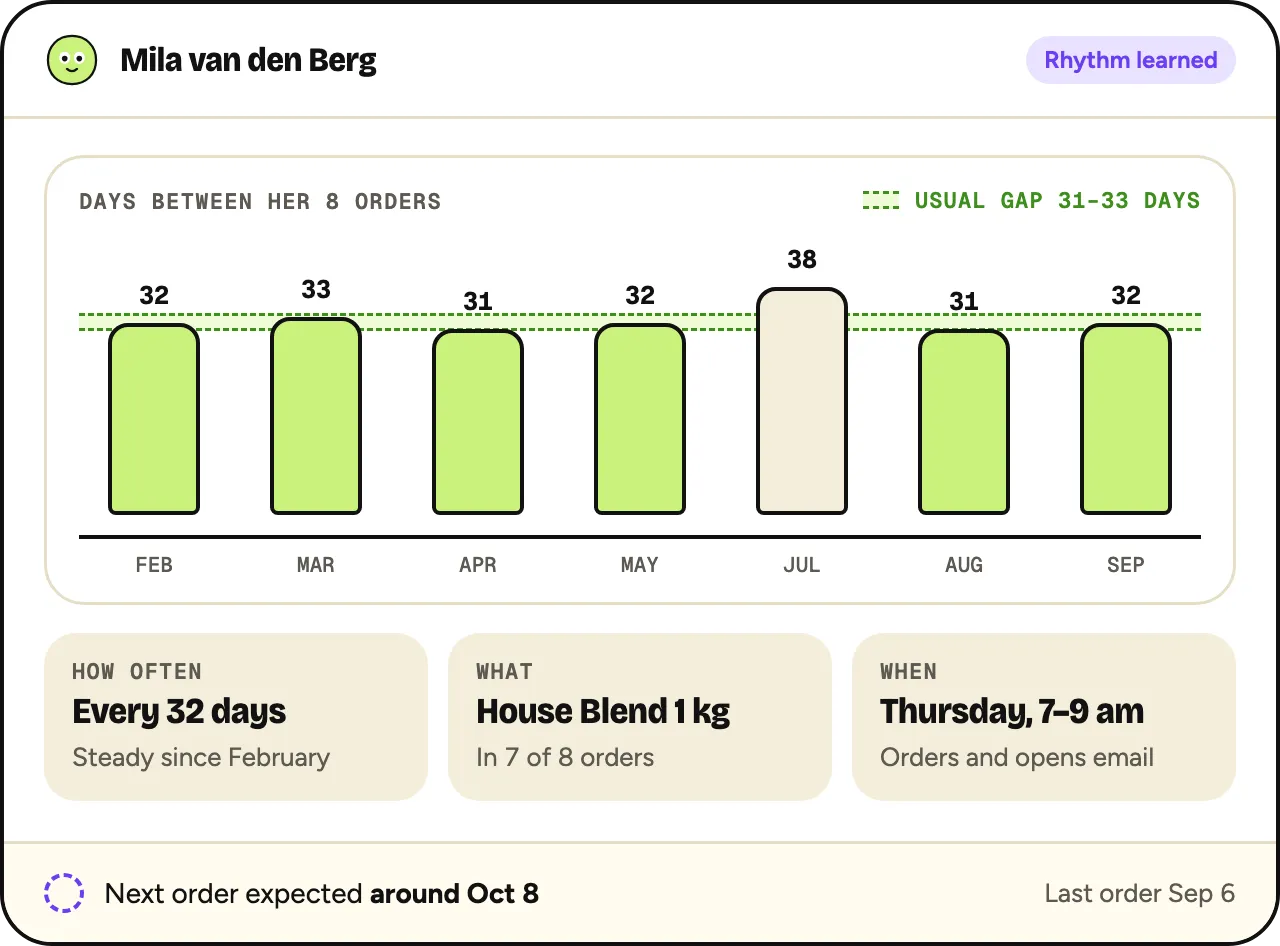
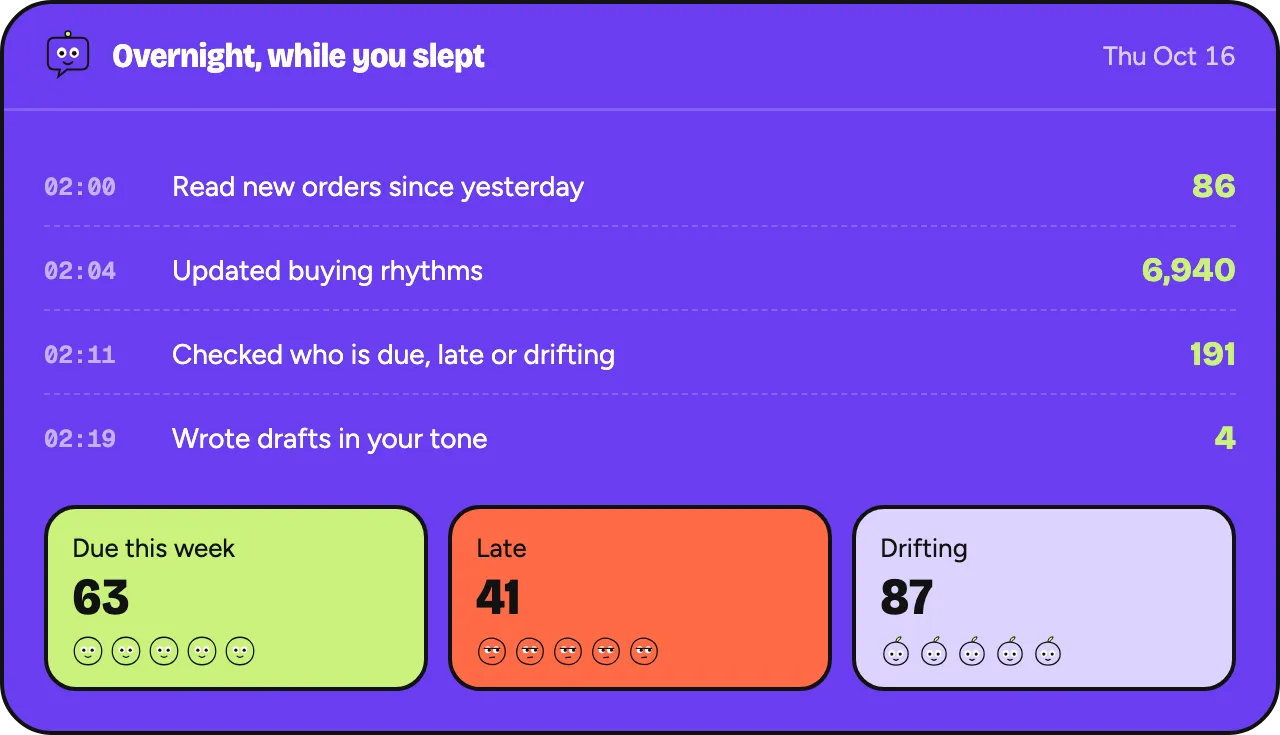
Oftenflow does this per customer, every morning.
Join the waitlistHistorical or predicted
Historical CLV is what customers actually brought in so far. It’s exact, but young customers look small because they haven’t had time yet.
Predicted CLV adds an estimate of what is still to come. It’s more useful for decisions, and easier to get wrong. Start with historical numbers per cohort, then extend with care.
Use margin, not revenue
A customer who spends €300 on products with a 35% margin leaves you €105 before marketing. That is the number to compare with what it costs to win or keep them.
- Take off product cost, shipping you pay, payment fees and refunds.
- Leave acquisition cost out here; you compare against it later.
- Discounts already lower revenue, so they lower margin too.
Margin per customer = revenue − product cost − shipping − payment fees − refunds.
Build it per cohort
Group customers by the month of their first order. For each cohort, add up margin per customer at 3, 6, 12 and 24 months after that order.
This shows how value builds up, and whether newer cohorts keep pace with older ones. Only use months that have fully passed for that cohort.
The January 2025 cohort has 500 customers. Total margin after 12 months: €27,500, or €55 per customer. First orders made up €22 of that, so €33 came from later orders.
A simple prediction
If you need a forward estimate, keep it plain and conservative. Build it from numbers you already measure.
€22 margin per order, a 25% second order rate, and returning customers who place 4 more orders in 24 months on average. 1 + 0.25 × 4 = 2 orders, or €44 per customer.
Check it against a real cohort that is 24 months old. If the two differ, use the lower one.
Predicted 24-month CLV = margin per order × (1 + second order rate × further orders per returning customer).
Mistakes that inflate it
- Using revenue instead of margin.
- Basing it on your best customers, or on account holders only.
- Assuming a lifetime of 5 or 10 years when your store is 2 years old.
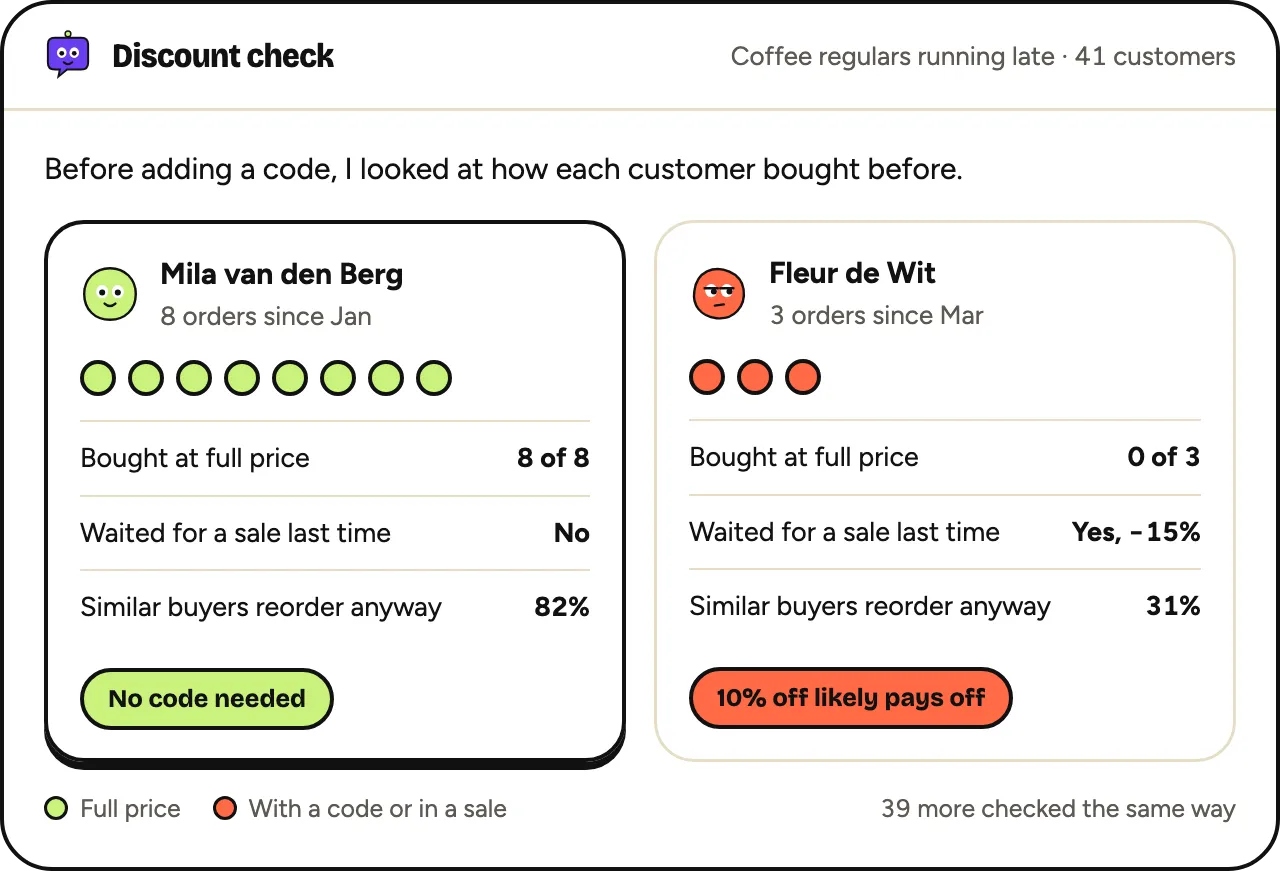
- Counting heavily discounted orders as if they were full price.
- Using one CLV for every channel, while buyers from different channels behave differently.
Retention or acquisition
Compare CLV with what a new customer costs. If a new customer costs €40 and 12-month margin is €55, you earn it back within a year, with little room.
Retention runs on the same numbers. Raising the second order rate from 23% to 27% in a 500-customer cohort means 20 more customers who come back.
Multiply those 20 by the margin of a returning customer to see what the change is worth. Spend up to that, and measure against a comparison group.
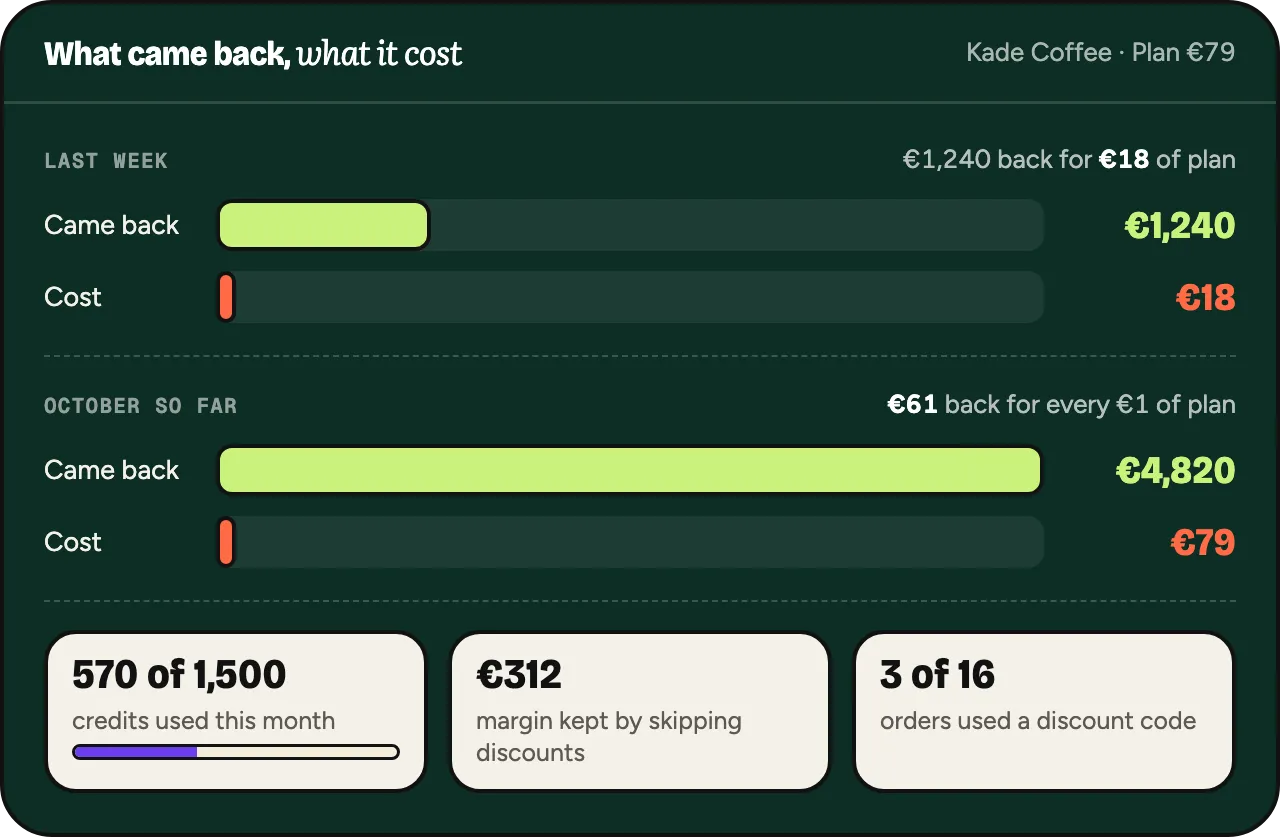
Oftenflow’s Monday email shows who came back after messages you approved, next to what it cost, measured against customers who got nothing.
Oftenflow is in development. This describes what we’re building.