RFM analysis for online stores, step by step.
RFM sorts customers by three questions: how recently did they buy, how often, and how much did they spend? It’s simple enough for a spreadsheet and still one of the most practical ways to segment a customer list.
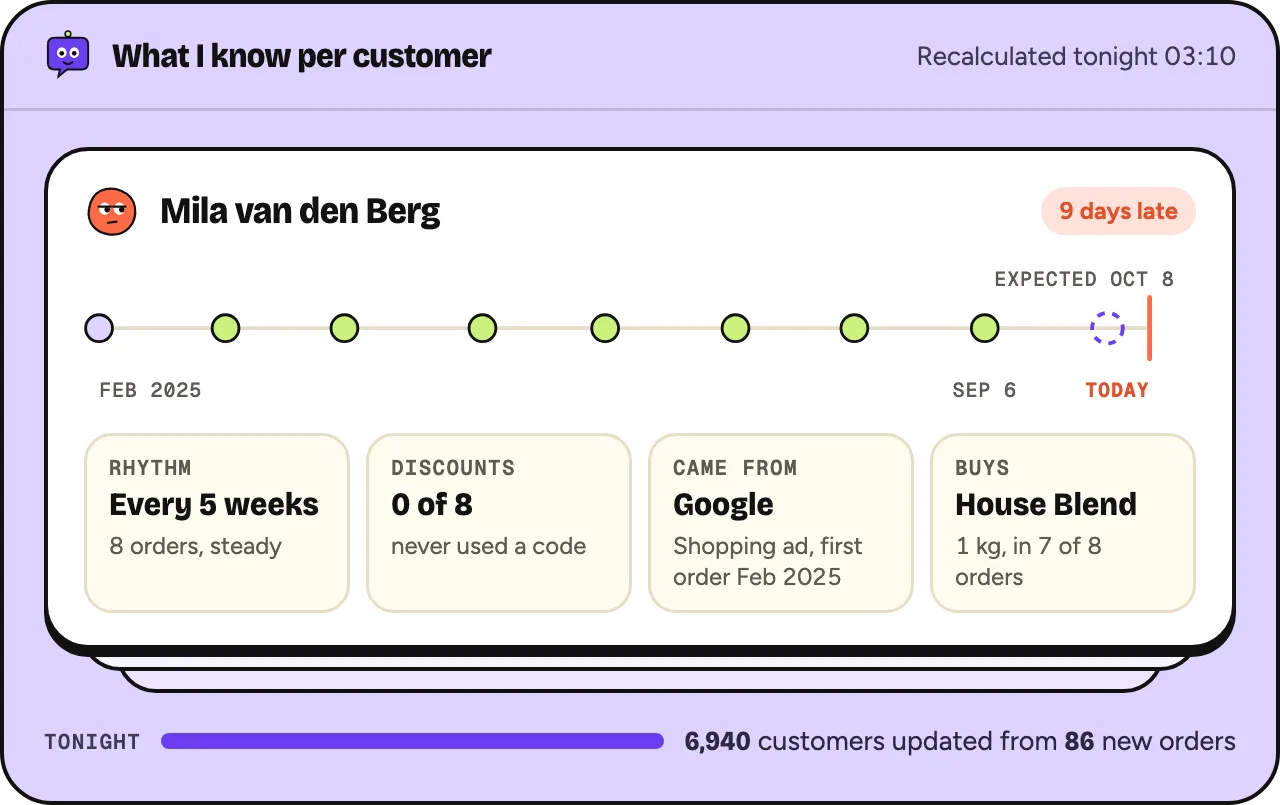
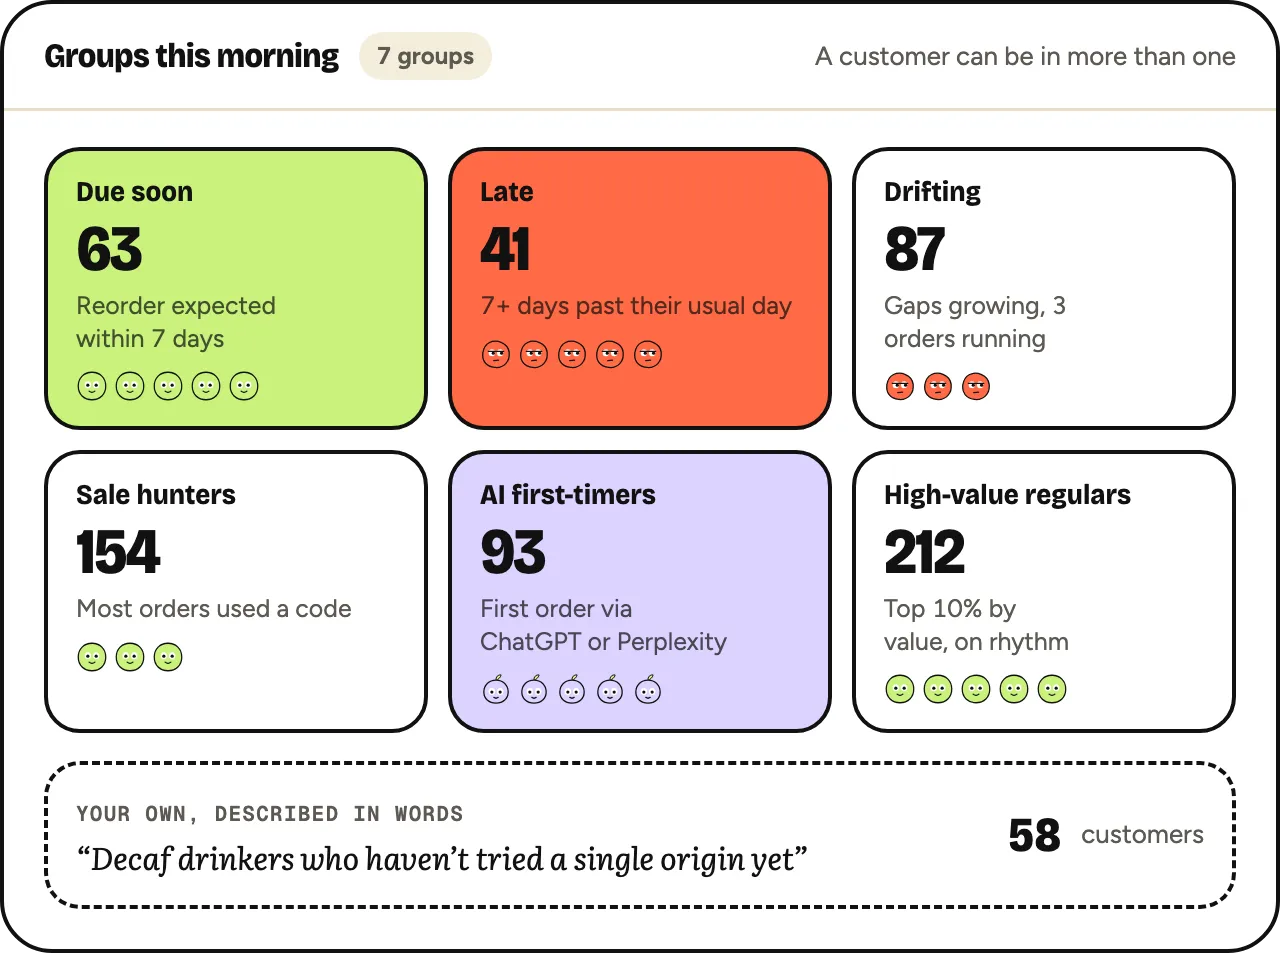
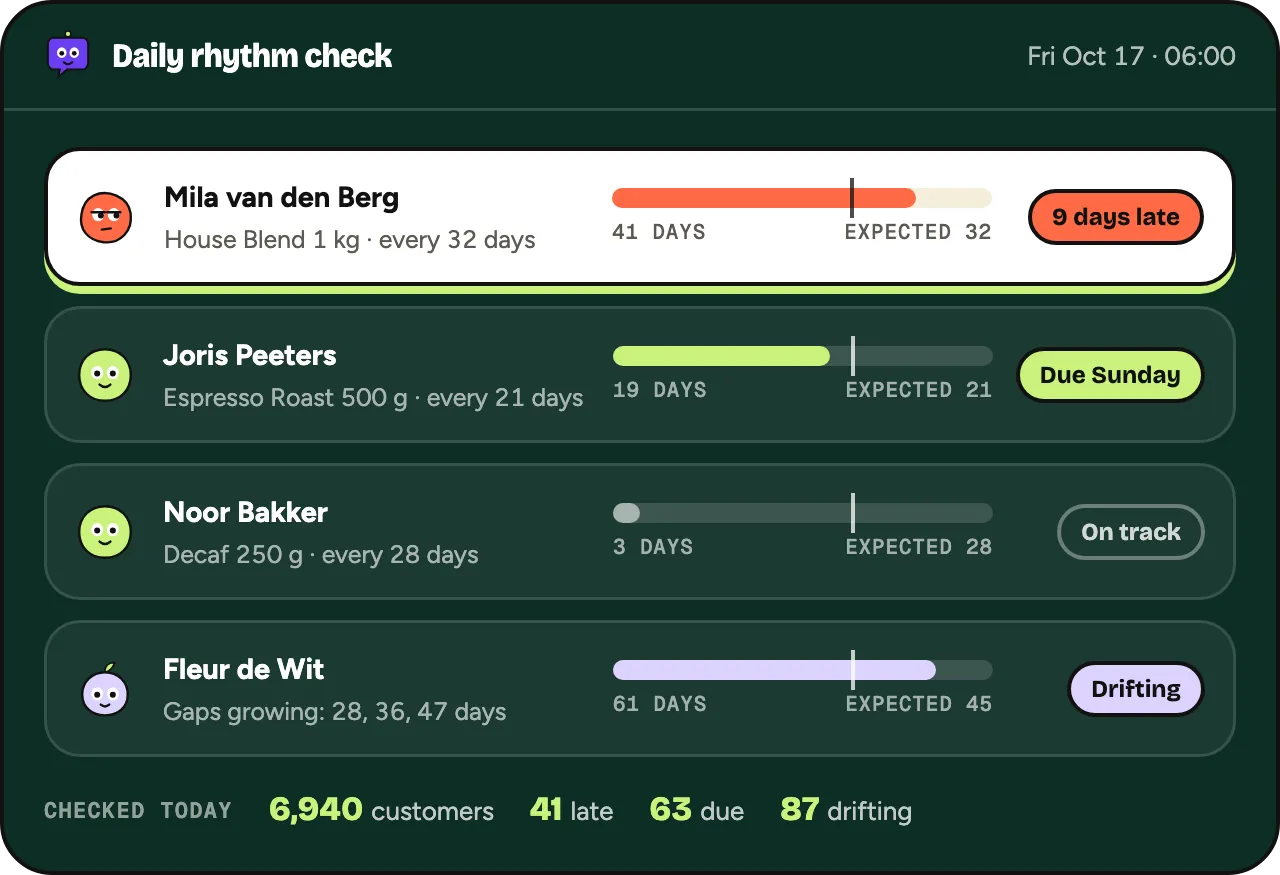
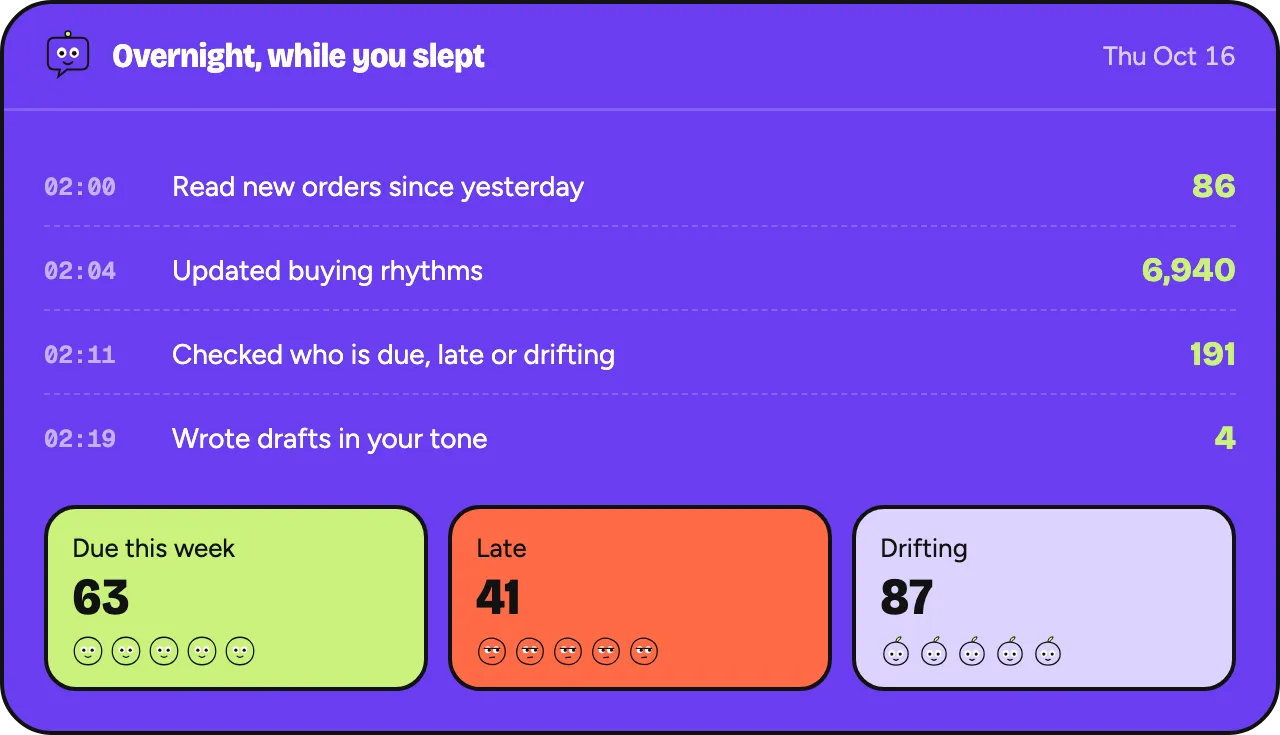
Oftenflow does this per customer, every morning.
Join the waitlistThe three scores
- Recency: days since the last order. Lower is better.
- Frequency: number of orders in a period, for example the last 12 months.
- Monetary: total spent in that same period.
Scoring in a spreadsheet
Export customers with their last order date, order count and total spent. Split each column into five equal groups and score them 1 to 5, with 5 for the most recent, most frequent and highest spending.
A customer who ordered 12 days ago, 6 times this year, for €310 in total might score 5-5-4. Someone who ordered once, 300 days ago, scores 1-1-1.
Groups worth acting on
- Champions (high on all three): thank them, ask for reviews, don’t discount.
- Loyal but slipping (high frequency, falling recency): remind them before they’re gone.
- New customers (high recency, frequency 1): make the second order easy.
- Lost big spenders (low recency, high monetary): one honest win-back, then let go.
Where RFM falls short
Recency treats every customer the same. Forty days without an order is normal for someone who buys every two months, and alarming for someone who buys every two weeks.
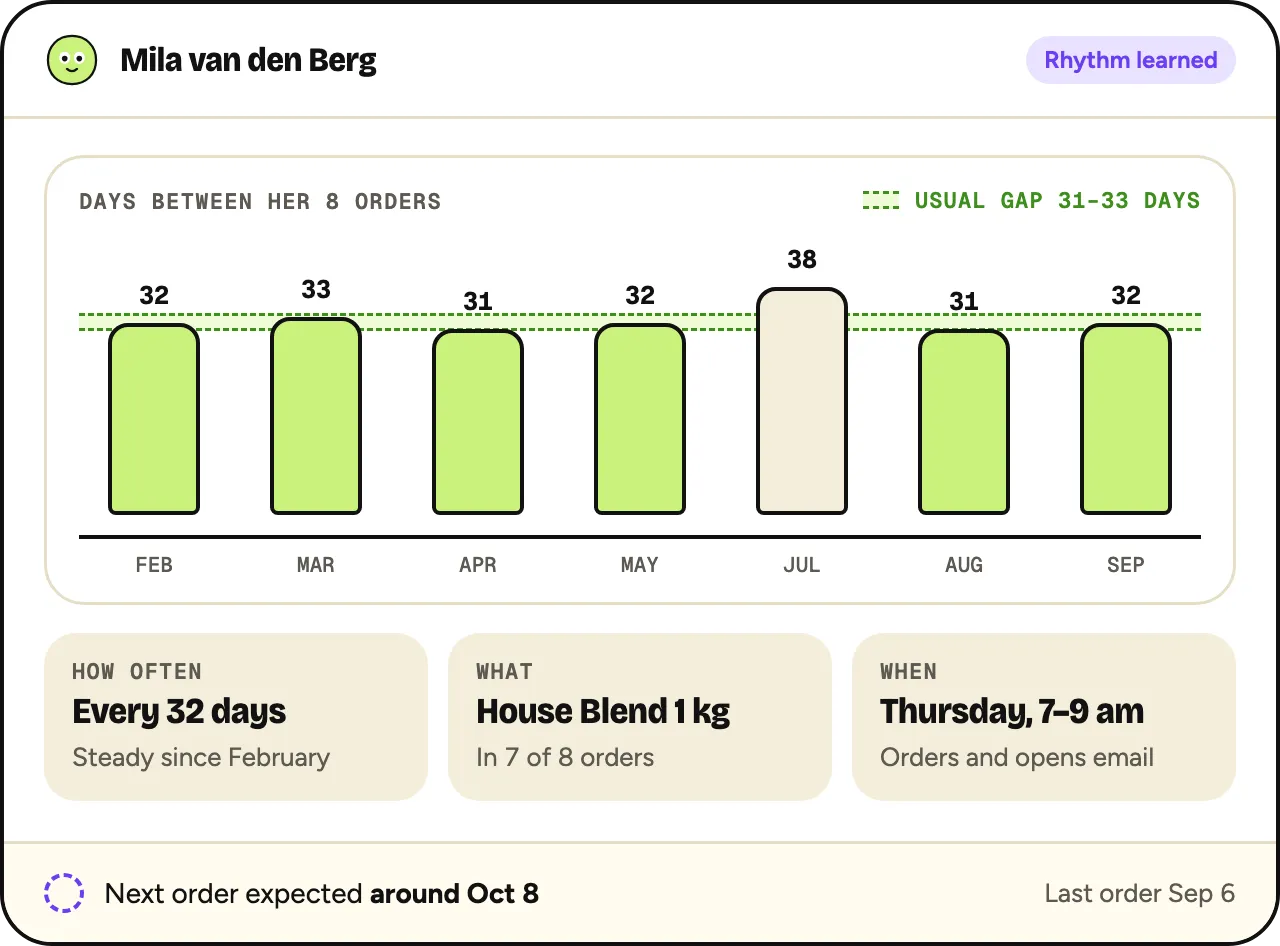
For consumable products, compare recency with each customer’s own interval between orders. “Late compared with their own rhythm” is a sharper signal than a fixed recency score.
Oftenflow adds that missing piece: an expected reorder date per customer and product, recalculated every night.
Oftenflow is in development. This describes what we’re building.