How to calculate the time between orders per customer.
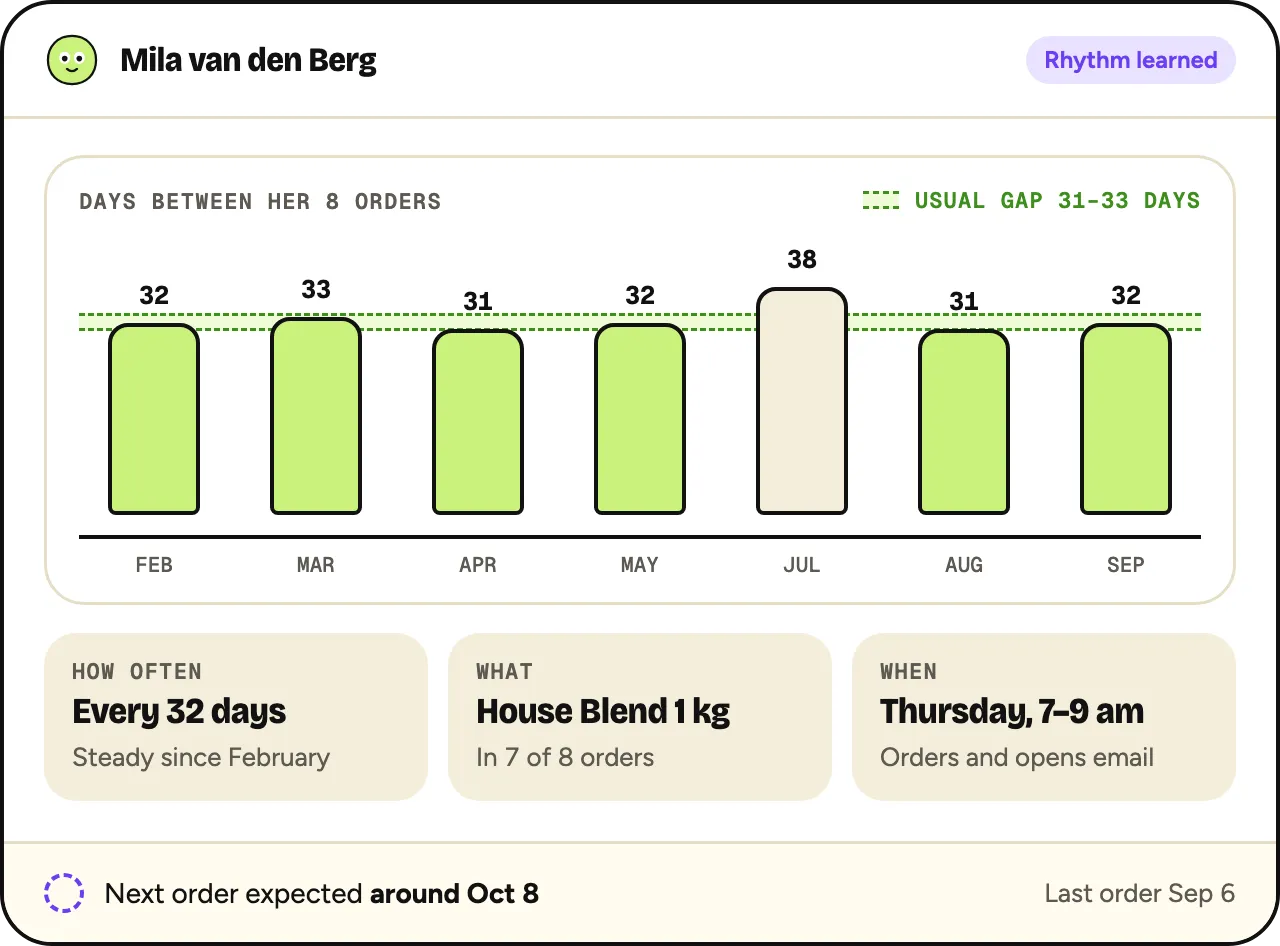
A store-wide average time between orders hides almost everything. Each customer has their own pace. Once you know it, you can see who is on time and who is late.
Oftenflow does this per customer, every morning.
Join the waitlistStart with the gaps
List each customer’s orders by date. A gap is the number of days between one order and the next.
A customer with five orders has four gaps. A customer with one order has none yet.
Orders on 3 January, 1 February, 28 February, 6 April and 2 May. Gaps: 29, 27, 37 and 26 days.
Use the median, not the average
One long gap, after a holiday or a stock-up, pulls the average up. The median is the middle gap and barely moves.
In the example, the average is 29.75 days and the median 28. Add one gap of 120 days: the average jumps to 47.8, the median moves to 29.
Usual interval = median of the gaps between consecutive orders of the same product.
Correct for quantity
Someone who buys two bags at once takes about twice as long to come back. Divide each gap by the quantity of the order that started it.
That gives days per unit. Multiply by the quantity of the latest order to get the expected next gap.
A customer usually lasts 14 days per bag. Their last order was 3 bags, so the next order is expected after about 42 days.
Few orders and outliers
- One order: no personal interval yet. Use the median for that product and size across all customers.
- Two or three orders: blend the customer’s own gaps with the product median, and lean more on their own as orders add up.
- Gaps of a few days: often a forgotten item or a split order. Merge them with the order before.
- Very long gaps: keep them, the median handles them. Leave out gaps caused by a stock-out on your side.
- Several products: calculate per product, not one number per customer.
Spot who is late
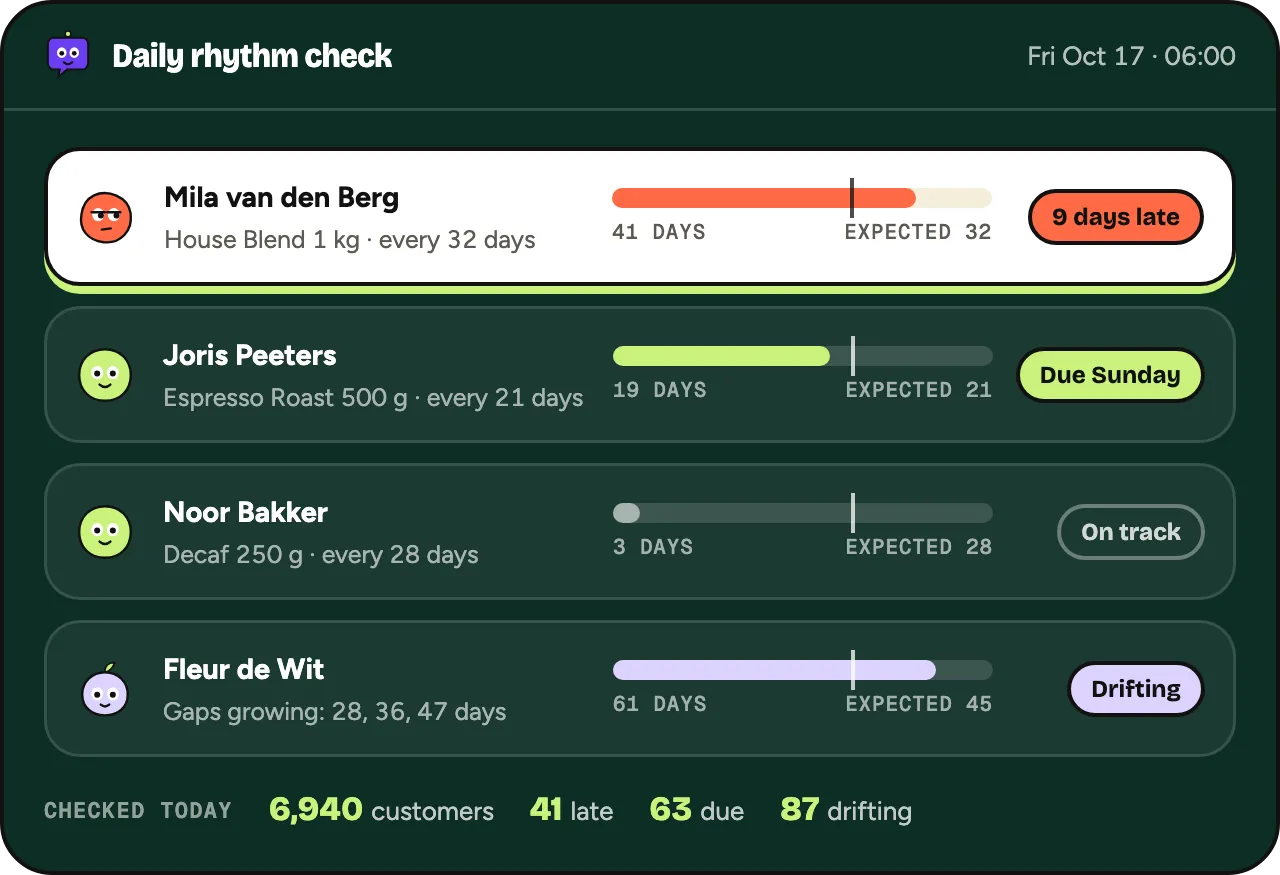
Compare the days since the last order with the expected interval. A ratio above 1 means later than usual.
Expected after 28 days, last order 40 days ago. 40 ÷ 28 = 1.43, so 12 days late.
Allow for spread. A customer whose gaps vary a lot isn’t worrying at 1.2. Start with a margin of about 20%, or use each customer’s own spread.
Lateness = days since last order ÷ expected interval. Above 1.2 is worth a look. Above 2, they may have switched.
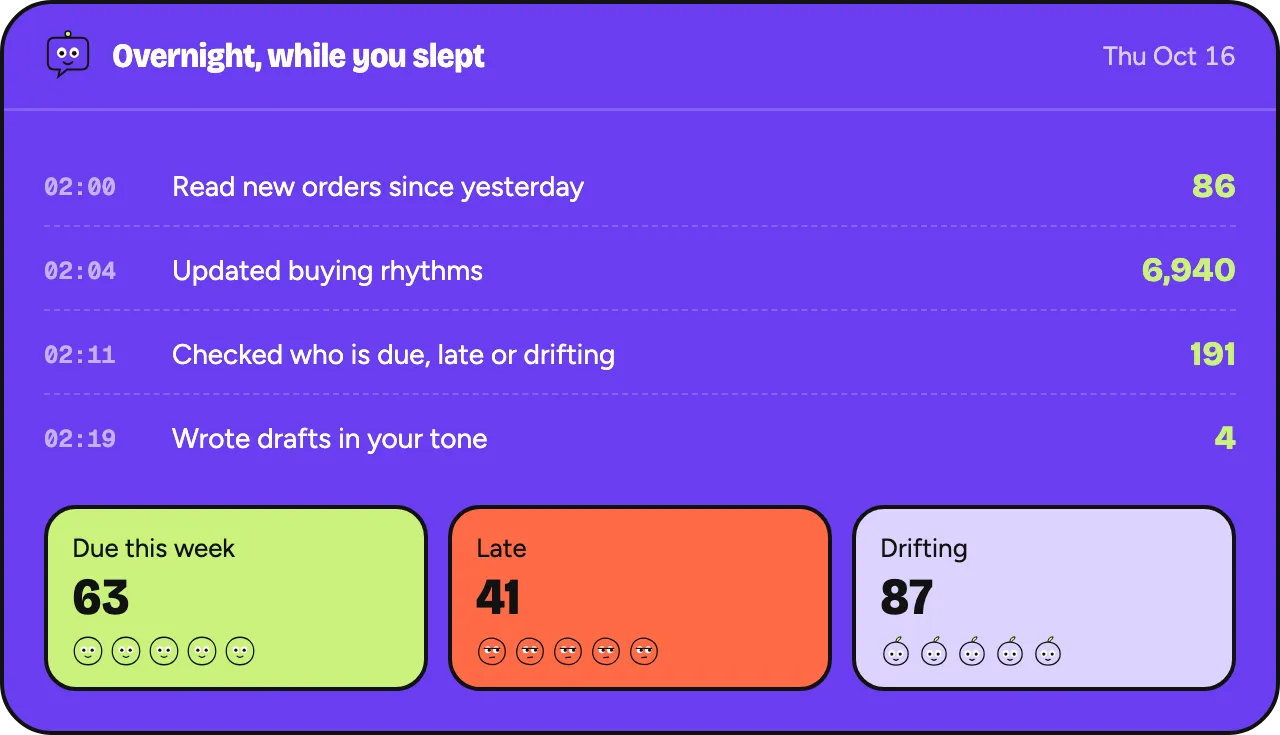
Oftenflow calculates this every night per customer and per product, corrected for quantity, and puts the customers who are late on the morning list.
Oftenflow is in development. This describes what we’re building.